Water Smart Cities Project
Article

Article

The operating log is the file containing information about the day-to-day operation of the treatment plant (water and sludge lines). The diversity of practices in terms of reporting in this operating log is quite astonishing, with some managers managing their plants on the spur of the moment, without much in the way of written records, and others accumulating a kirielle of analyses, measurements and other information on a daily basis. The intensity of reporting is generally proportional to the size of the treatment plant. Beyond simple reporting, the usefulness of a good operating log also lies in the actions it will enable to optimise the process. To do this, a choice of indicators is necessary.
What follows is obviously indicative and fairly general, as each plant differs in terms of its technology, capacity, stability, managerial attention, etc. Each operating log needs to be adapted.
‘Ne quid nimis’, nothing too much. But nothing is too little either. What type of analysis or measurement should be carried out, at what point, how often and for what purpose? The approach can be structured as follows.
1. Data collected for the purpose of monitoring the smooth operation of the network
Assuming that the system is operating correctly when the effluent and sludge discharged are of the desired quality, the assessments should be carried out at these two points. And there's no need to carry out a battery of analyses to assess this: a quick inspection, using strips/quick kits, is all that's needed. For the effluent, clarification can be judged by eye and purification by means of rapid tests (N-NOx, N-NH4 and Portho). For the sludge process, it is also visual (lumpy appearance, water loss, etc.) and tactile (texture). These parameters are assigned 3 levels: good, suspect or bad. In the last two cases, the values need to be clarified by analysis. Ideally, you should go round the plant every day - and at least once a week.
2. Data collected for control purposes
This refers to the analysis campaigns carried out on the effluent as part of the tax and compliance with discharge standards, and also analyses relating to the sludge discharged. This information is complementary to that collected for monitoring the correct operation of the system.
3. Data required for facility management
The data to be collected is :
These three sets of data (monitoring, control and management) will enable useful indicators to be identified for reporting, infrastructure management and cost purposes - and consequently for corrective action or optimisation (reagents, energy, etc.).
4. Indicators
There are several types of indicators:
These indicators are compared with reference values relating to regulatory requirements or guide values defining good operation of the system.
5. Other
In the event of drift, standard corrective actions can be described in the operating log (e.g. purge the sludge depending on the concentration of suspended solids in the tank, correct the phase alternations or the recirculation flow rate if nitrogen levels are exceeded, etc.), which are also fed by the operator's feedback.
Incidents must also be recorded in the logbook, as some are associated with a drift in the plant.
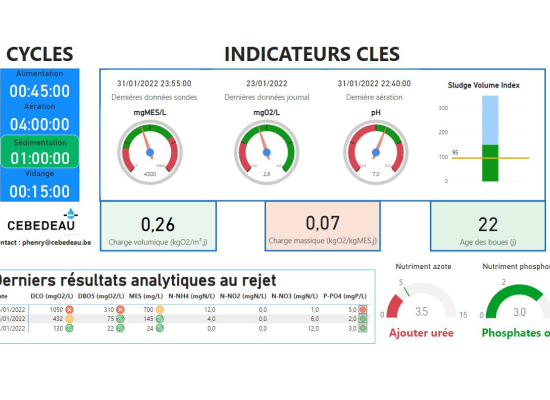
An XLS spreadsheet is all you need to encode the data (points 1, 2 and 3).
Indicators can be calculated and all the data consulted using a data processing and display programme such as power Bi, Dataviz….correct phase alternations or the recirculation flow rate in the event of nitrogen levels being exceeded, etc.), which can also be fed by feedback from the operator.
Incidents must also be recorded in the logbook, as some are associated with a drift in the plant.
Article

Article

Event
